How To Use Analytics for Mini App Growth
Analytics helps grow your Telegram Mini App by showing how users interact with it, what works, and what doesn’t. Here’s how you can use it effectively:
-
Track Key Metrics: Monitor user growth (DAU/MAU), engagement (session length), retention (Day 1/7/30 rates), and conversions.
-
Understand User Behavior: Analyze where users drop off, what features they use, and how they navigate your app.
-
Improve Marketing & Revenue: Identify the best-performing acquisition channels and optimize monetization strategies.
-
Compare with Competitors: Use tools like FindMini.app to benchmark your app against top-performing apps.
Set up analytics by integrating tools, tracking events, and testing data accuracy. Use these insights to improve your app’s performance and stay ahead in the market.
Data Analytics for Growth Marketing
Analytics Setup Guide
Once you’ve outlined your growth goals, the next step is to set up analytics by picking the right tools and tracking the most important metrics.
Choosing the Right Analytics Tools
Select tools that give you insights into user behavior and performance metrics. Focus on areas like:
-
User tracking: Monitor new vs. returning users.
-
Engagement: Measure session length and how users interact with features.
-
Retention: Track how often users come back over time.
Steps to Implement Analytics
-
Integrate SDK/API: Add the required dependencies and initialize the setup with your app’s unique ID.
-
Set Up Event Tracking: Configure events to monitor user counts, engagement, retention rates, and conversions.
-
Test and Validate: Ensure data is being captured accurately by checking real-time events in your analytics dashboard.
Key Metrics to Monitor
-
User Growth: Track Daily and Monthly Active Users (DAU/MAU) to understand adoption trends.
-
Engagement: Look at session duration and feature usage to see how deeply users interact with your app.
-
Retention: Monitor Day 1, Day 7, and Day 30 return rates to measure user loyalty.
-
Conversion: Keep an eye on goal completion rates to evaluate how well users achieve desired outcomes.
With your analytics set up, you can start analyzing user behavior to identify opportunities for growth.
Finding Growth Through Data
Understanding User Behavior
Leverage your analytics to dive deeper into metrics like daily active users (DAU), session length, and retention rates. These numbers reveal how features are used and what drives revenue. Connect acquisition channels to lifetime value (LTV) to identify which sources deliver the best returns. Use this data to reallocate marketing budgets toward the most effective channels and refine your conversion funnel.
Analyzing the Conversion Funnel
Chart out the user journey to find where users drop off. For each stage of the funnel, analyze drop-off rates by acquisition channel and tweak campaigns to improve conversions. Once you’ve minimized friction, shift your focus to building long-term engagement through retention strategies.
Tracking User Retention
Apply cohort analysis to measure retention rates across different acquisition sources. Pinpoint the channels that bring in the most loyal users and adjust your marketing efforts to prioritize those high-performing sources. This ensures you’re not just acquiring users but keeping them engaged over time.
Data-Based Improvements
Use analytics to turn insights into focused changes by testing, prioritizing, and keeping a close eye on results.
Testing Features
Conduct A/B tests to evaluate specific changes. For example, compare different onboarding processes or button placements to see how they influence user behavior.
Acting on Data
Pinpoint where users drop off or how they interact with features. Then, address the most pressing issues to improve engagement over time.
Performance Tracking
Set up dashboards to monitor key metrics like daily active users (DAU), retention rates, and conversions. These tools help you measure the impact of your efforts and identify new opportunities for growth.
Finally, use market analytics to compare your mini app’s performance with competitors and discover external strategies for expansion.
Market Analysis Tools
Combine insights from the market with your in-app metrics to fine-tune your growth strategies.
Why Market Data Matters
Market data helps uncover opportunities and supports your growth plans. Here’s how you can use it:
-
Focus on features that align with market demand
-
Develop user acquisition strategies tailored to specific niches
-
Create monetization strategies that connect with your audience
Using FindMini.app Tools
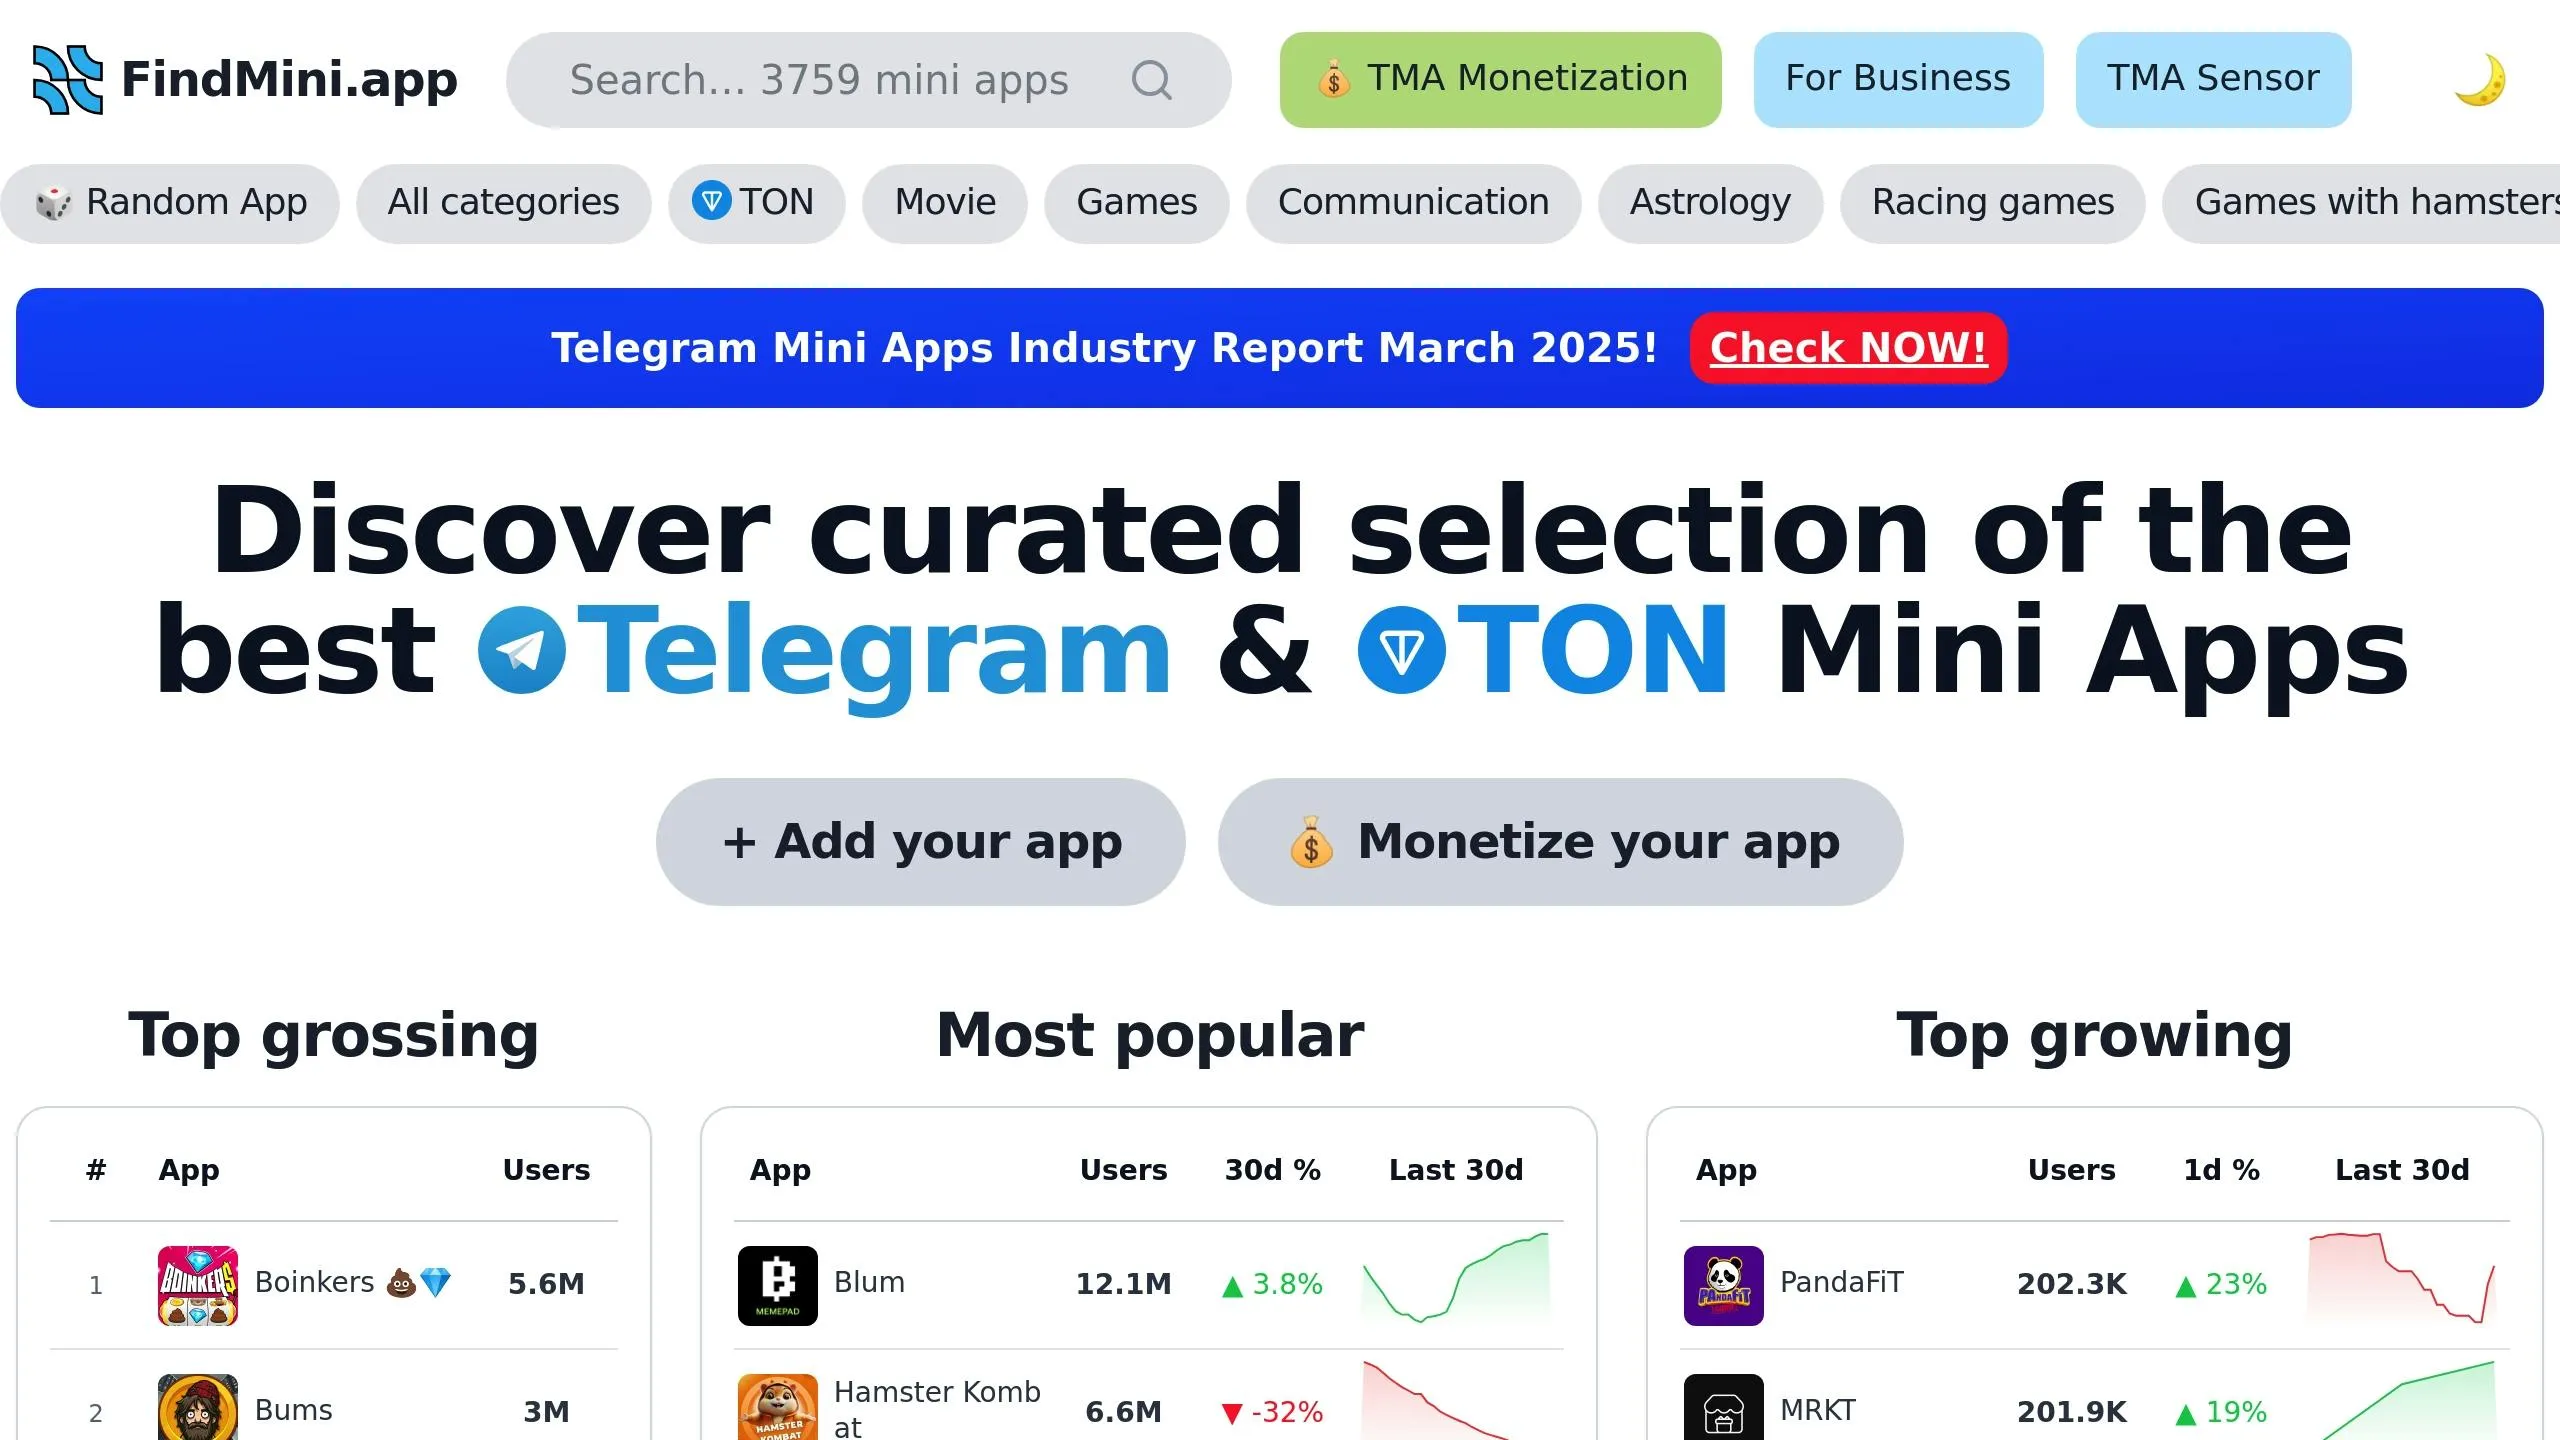
FindMini.app provides valuable metrics across the app ecosystem [1]:
-
Top Grossing: Highlights apps generating the most revenue - study their monetization methods.
-
Most Popular: Shows apps with the largest user base - understand what makes them appealing.
-
Top Growing: Tracks the fastest-growing apps - spot emerging trends early.
-
User Growth: Measures percentage changes over 1, 7, and 30 days - keep an eye on momentum.
Comparing Performance
To measure your app’s success effectively:
-
Compare your metrics to those of category leaders
-
Track growth rates across various timeframes
-
Study the features driving success for competitors
-
Keep a record of how your market position evolves
Blend these benchmarks with your user behavior data to identify areas for improvement and refine your approach.
Summary
Combine in-app analytics with FindMini.app’s market data to fuel the growth of your Mini App. By merging user behavior insights with data from over 3,900 apps, developers can spot opportunities, refine features, and make informed decisions to boost performance.
Next Steps:
-
Identify key metrics that align with your growth objectives
-
Set up analytics tracking and conduct regular testing
-
Analyze user behavior patterns and emerging trends
-
Compare your app’s performance to industry leaders
Use FindMini.app’s analytics tools to measure your app’s progress against market benchmarks and uncover new ways to grow.