How To Analyze User Behavior In Mini Apps
Want to make your Telegram mini app better? Start by analyzing user behavior. Here’s how:
-
Track key metrics: Focus on Daily Active Users (DAU), Monthly Active Users (MAU), retention rates, and session frequency to understand engagement and growth.
-
Spot drop-offs: Identify where users abandon tasks or exit your app by analyzing session lengths, user flows, and exit screens.
-
Map user journeys: Monitor user paths to key actions, group users by behavior, and adjust workflows to improve experiences.
-
Use market data: Tools like FindMini.app let you compare your app’s performance with over 3,900 mini apps, track growth trends, and study successful competitors.
-
Refine strategies: Learn from top apps to enhance features, boost monetization, and reduce churn.
Example: DRFT used analytics to reach 3 million MAU, rank among the top 9 grossing apps, and sell out an NFT drop in 3 hours. Start tracking today to unlock similar growth.
Measuring Success: Analytics Strategies for Telegram Mini Apps
Getting Started with Analytics Tools
Plan your strategy for tracking and measuring success:
Tools and Setup Steps You’ll Need
-
Select an analytics platform that supports the Telegram WebApp SDK.
-
Define 3–5 key performance indicators (KPIs) that align with your goals, such as daily active users (DAU), retention rate, or conversion rate.
-
Decide on attribution methods, like UTM parameters or referral links, and ensure your marketing channels are aligned with these metrics.
After that, connect your chosen analytics platform to Telegram’s WebApp API to start collecting data.
Main Metrics for User Analysis
Tracking the right metrics is the first step in understanding how users interact with your Telegram Mini App. Let’s break down the most important ones.
User Activity Metrics
To gauge how engaged users are, focus on these core measurements:
-
Daily Active Users (DAU): The number of unique users who interact with your app daily. This shows how often people are using it.
-
Monthly Active Users (MAU): The total unique users over a month, reflecting your app’s overall reach and growth.
-
Retention Rate: The percentage of first-time users who return. This indicates how well your app keeps users coming back.
-
Session Frequency: The average number of visits per user. This helps you understand user habits and how often they rely on your app.
After reviewing these metrics, the next step is identifying where users drop off to improve retention.
Spotting Drop-Off Points
Understanding where users stop using your app is crucial for minimizing churn. Here’s how to pinpoint those areas:
-
Analyze average session length and look for patterns in exit screens to find points of friction.
-
Examine user flows to identify where people abandon tasks, such as during onboarding, payments, or other key activities.
-
Use tagging to track specific screens or actions where abandonment rates are high, helping you prioritize updates to improve the user experience.
Understanding How Users Use Your App
To improve your app’s performance, it’s crucial to analyze how users interact with it. This involves mapping their journeys and grouping behaviors to identify pain points and increase engagement.
Tracking User Paths to Goals
Set up goal tracking for important actions within your app. Monitor the sequence of screens users navigate, track the steps they take, and measure how long they spend on each. This helps you uncover areas where users encounter obstacles, allowing you to adjust workflows and improve conversion rates.
Grouping Users by Behavior
Divide users into groups based on how often they use your app, which features they interact with, the order of their activities, and how their behavior shifts over time. This segmentation allows you to fine-tune recommendations, deliver targeted messages, and make meaningful updates to your app’s design.
Market Data and App Growth
Dive deeper into app performance by combining in-app behavior analysis with broader market data. FindMini.app helps you refine strategies to improve your app’s reach and performance.
FindMini.app Market Analysis Tools
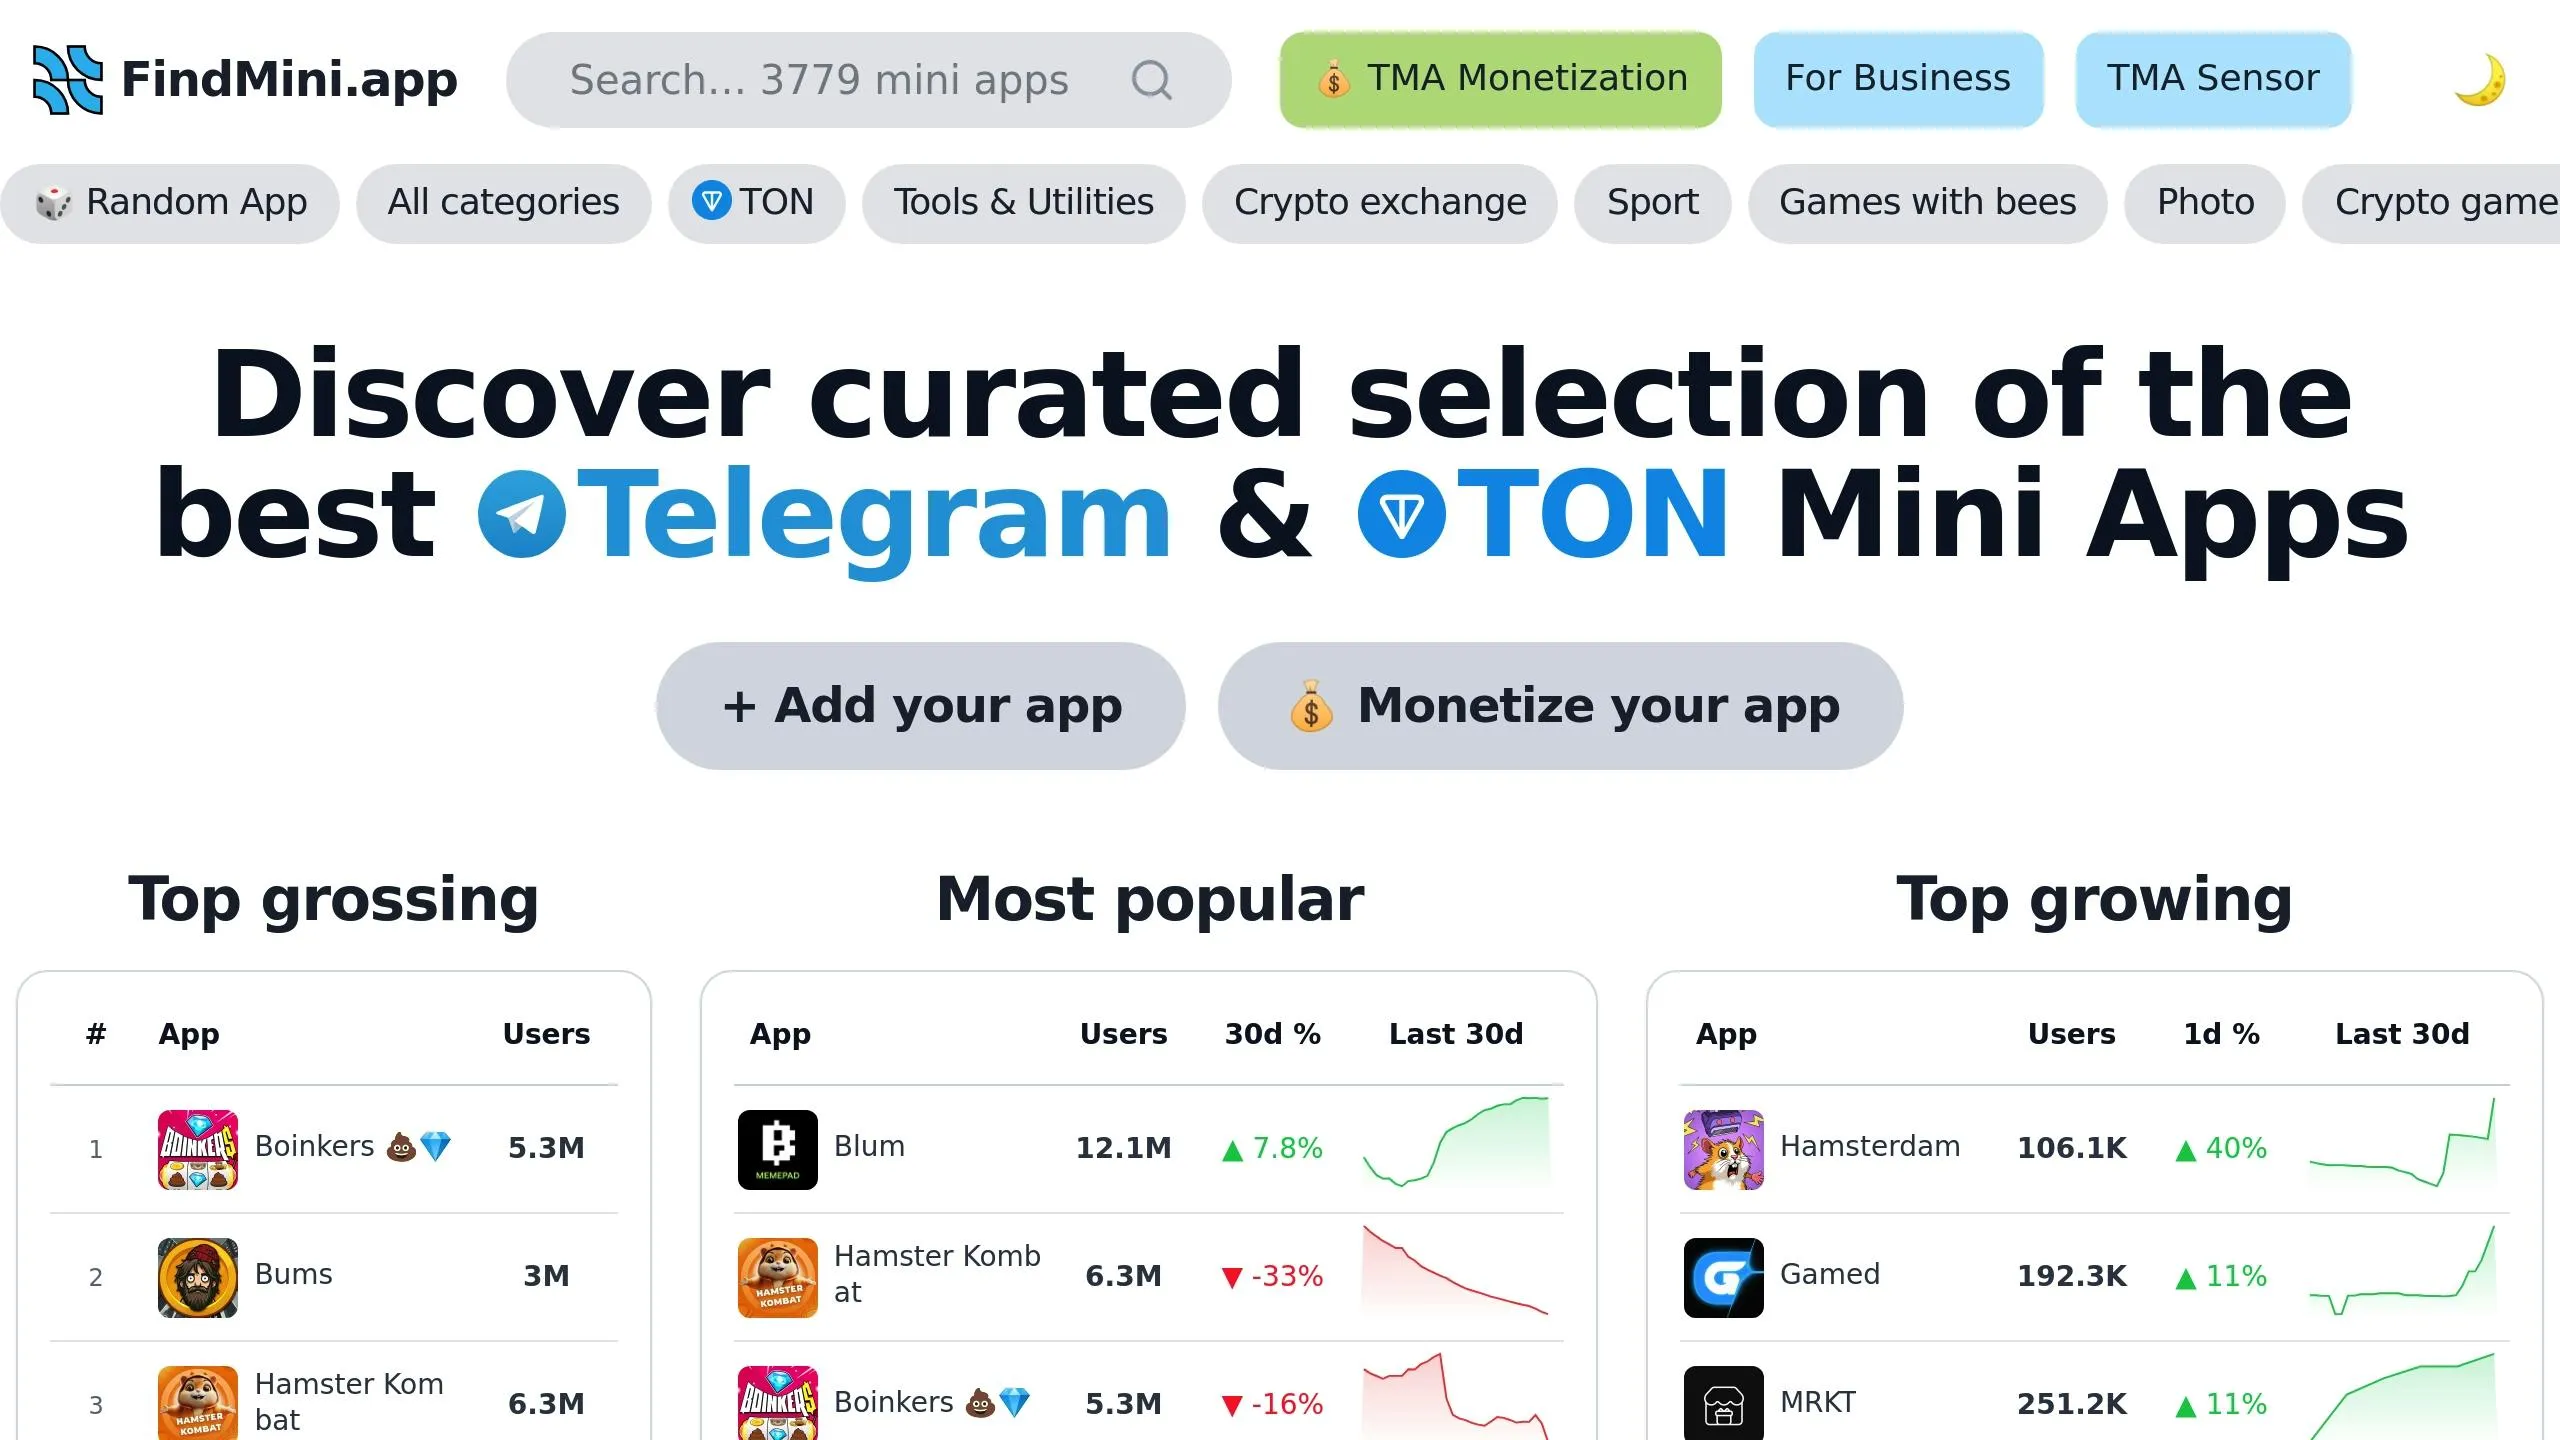
FindMini.app tracks several critical metrics, including:
-
Users: Understand your app’s overall reach and adoption.
-
Followers: Gauge the level of community engagement.
-
1-day Growth: Detect short-term trend shifts.
-
7-day Growth: Observe weekly performance patterns.
-
30-day Growth: Assess long-term growth sustainability.
You can also explore real-time rankings and top-performing apps to identify trends as they emerge [1].
Turning Data Into Growth
Leverage market insights to develop actionable strategies, such as:
-
Performance Benchmarking: Analyze features of top-growing apps to refine your own.
-
Identifying Opportunities: Compare growth rates of similar apps to inform your development plans.
-
Monetization Tactics: Study revenue models of top-grossing apps to optimize pricing and timing.
Regularly reviewing 7-day and 30-day growth metrics can provide dependable indicators of market trends [1].
[1] FindMini.app tracks user counts, follower counts, and 1-day, 7-day, and 30-day growth percentages for Telegram Mini Apps.
Conclusion
Analyzing user behavior with tools like analytics platforms and FindMini.app’s market data gives you access to benchmarks from over 3,900 mini apps. This allows you to compare your performance with top players like Blum (12.1 million users) and Hamster Kombat (6.6 million users) [1].
Here are some actionable tips to improve your mini app:
-
Study user activity patterns to uncover areas where your interface or features could be improved.
-
Track engagement metrics to pinpoint where users lose interest and make adjustments to keep them engaged.
-
Use market data to guide your development plans and growth efforts.
-
Analyze competitor insights to fine-tune your monetization strategies.
For example, DRFT combined analytics with market data to hit 3 million monthly active users and secure a spot in the Top-9 App Grossing list in May 2025.